Managing our GHG emissions
This year Downer’s GHG emission intensity increased by 7.5 per cent when compared to FY17 levels, primarily due to the growth in our Transport and Utilities businesses where revenue increased by 35 per cent, and the acquisition of Spotless.
In FY18, Downer's energy and emissions changed from FY17 as per table below:
Consumption and emissions increased considerably for the year due to the acquisitions of Spotless and growth in the business, as reflected by the 14% increase in total revenue for the year. Contractor data is included in our energy data with the exception of Spotless Australia and New Zealand. As a contract service provider operating within carbon-intensive industries, a key challenge for us is the effective management of our carbon-related activities.
Again, the primary source (61 per cent) of our total Scope 1 and 2 GHG emissions is the consumption of liquid fossil derived fuels (mostly diesel oil) used in our transport fleet and the production of stationary energy in our asphalt and other manufacturing plants. Our carbon intensity and energy intensity vary from year to year, due to changes in production, project opportunities and fluctuations in revenue streams.
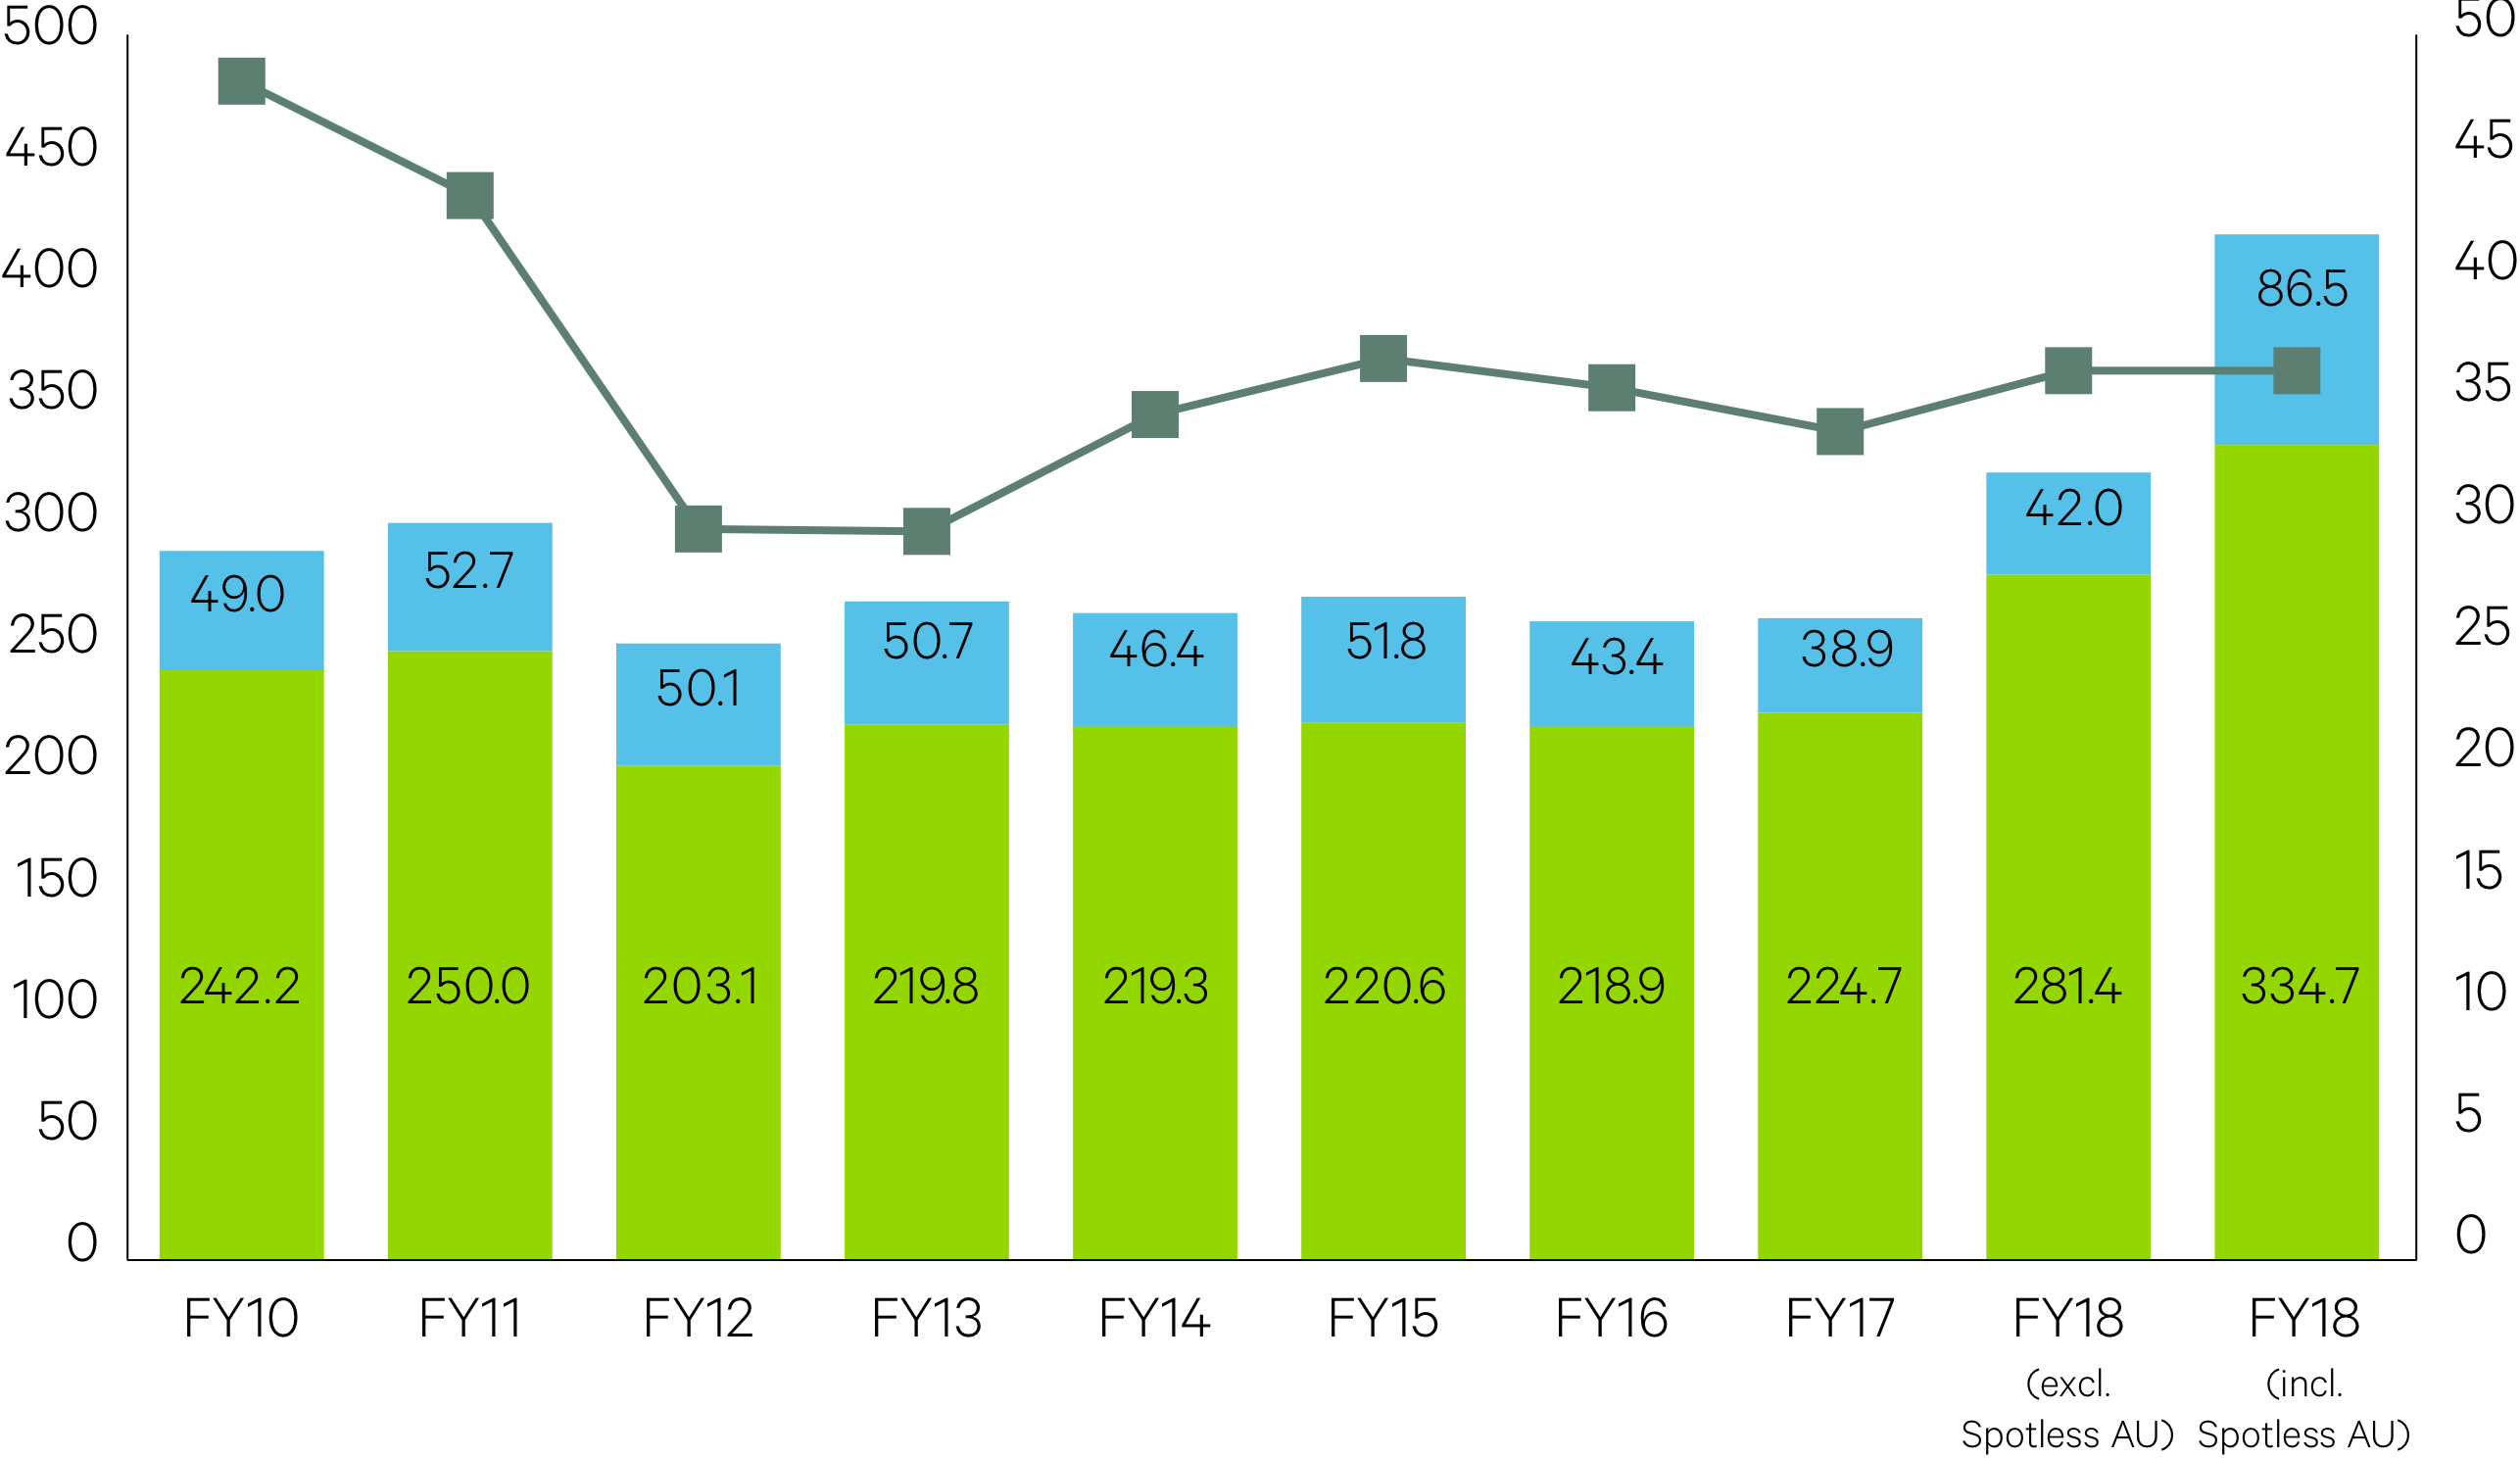
Scope 1 and 2 Greenhouse Gas Emissions (ktCO2-e)
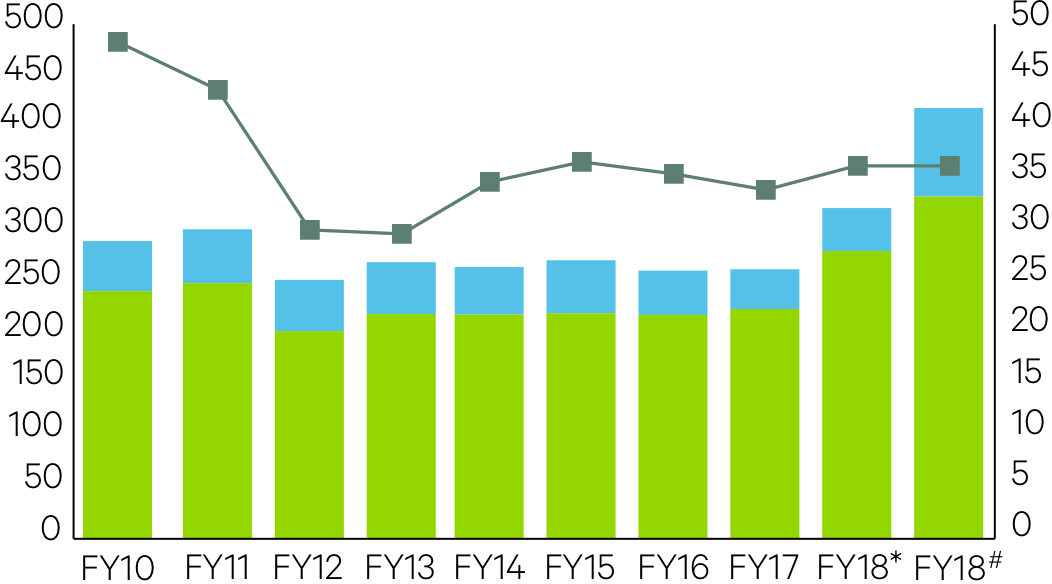
GHG emissions: Scope 1, 2 and GHG emissions intensity
Breakdown of Scope 1 and 2 emissions by source (ktCO2-e)
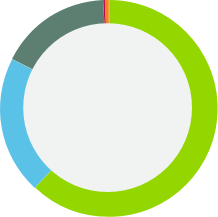
GHG emissions by source (Natural Gas, Electricity, Liquid Fuels, Fugitive emissions and Refrigerants).
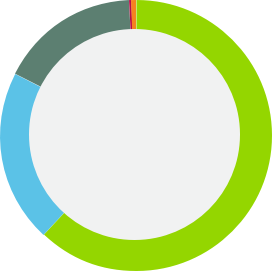
Breakdown of Scope 1 and 2 emissions by Business Line
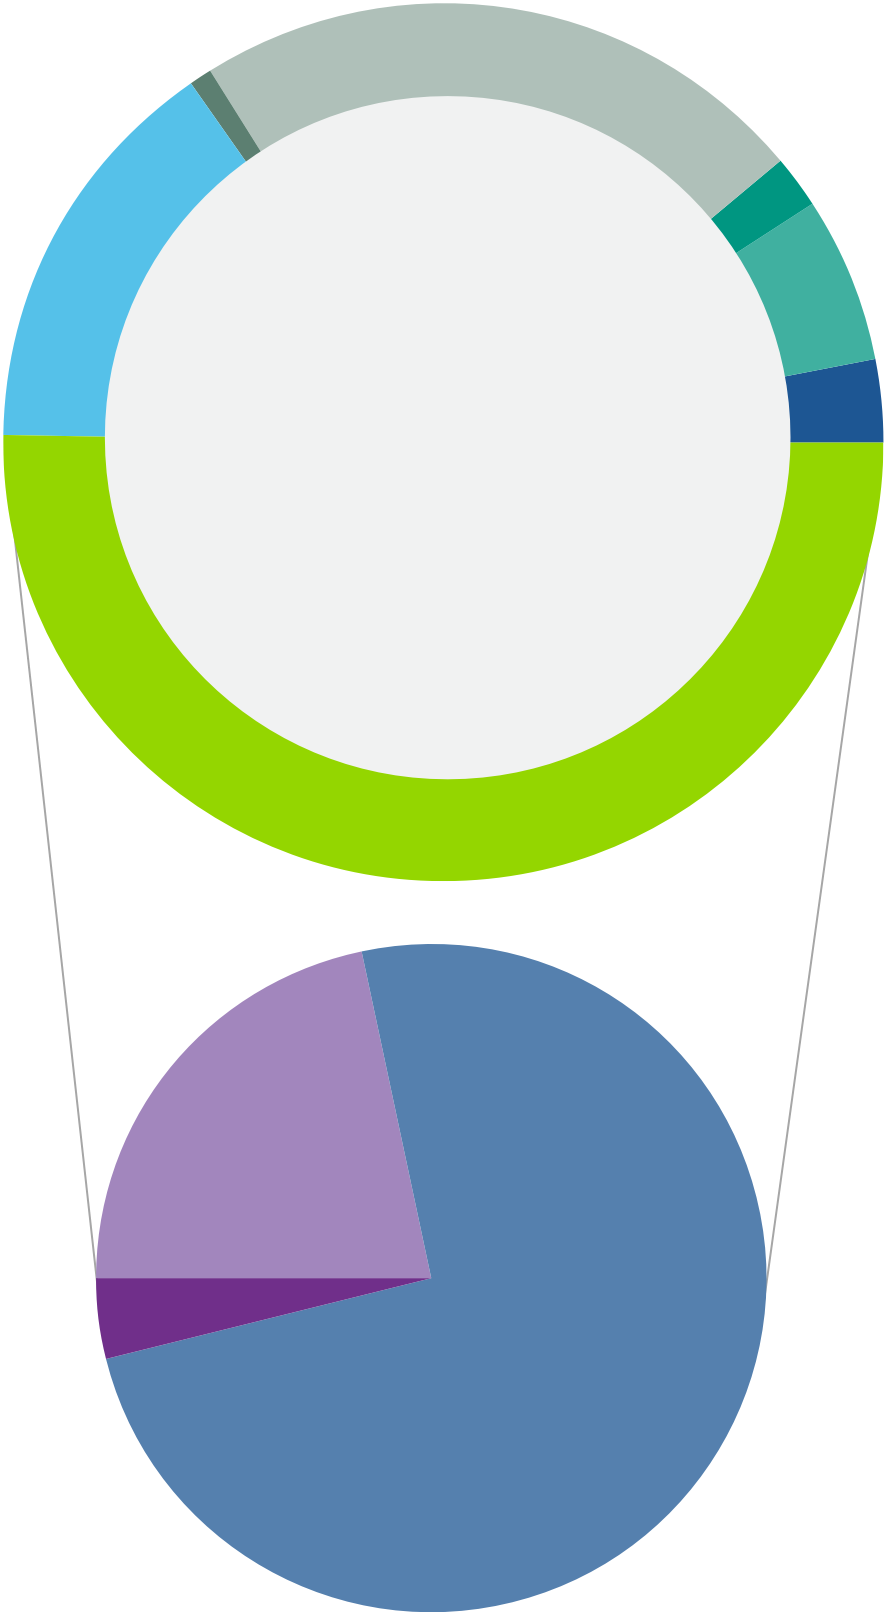
GHG Emissions (Scope 1 and 2) by division

In FY18, carbon intensity increased by 7.54 per cent and energy intensity increased by 0.9 per cent. During the year, our Scope 1 emissions increased by 49 per cent and our Scope 2 emissions increased by 122 per cent, as a result of increase in growth and improved data capture and reporting through the implementation of the Envizi platform.
Despite the increase in carbon and energy intensity, this we implemented 45 new projects during FY18 with a combined capacity to deliver annualised abatement of over 12,491 tonnes of annualised GHG emission (CO2-e) reductions across Scope 1 (natural gas efficiency projects, vehicle replacement and optimisation), Scope 2 (lighting upgrades) and defined Scope 3 (energy consumption for non-operational control projects, substitution and reuse of materials in construction including fly ash, slag, optimising delivery routes for materials).
In FY19, due to the restructure of the business and acquisitions, Downer is resetting the GHG emission baseline year levels to FY18 and each division is developing a three-year GHG reduction plans with new targets for both FY19 and an aspirational target for FY21.