GHG emissions reduction target
A key consideration of the TCFD recommendations is the pathway to reduce emissions and the establishment of targets. Downer has set ambitious targets to align with the 2015 Paris Agreement goals to pursue efforts to limit the temperature increase to 1.5°C by the end of this century.
Downer acknowledges that climate change mitigation is a shared responsibility and to support the transition to a low carbon economy in an equitable manner, organisations need to play their part by developing emissions reduction targets that align to the latest science. Therefore, Downer has leveraged the Science Based Target initiative’s framework and guidance to set a GHG emission reduction target for the Downer Group.
Downer commits to the decarbonisation5 of its absolute Scope 1 and 2 GHG emissions by 45-50 per cent by 2035 from a FY18 base year and being net zero in the second half of this century.6
In addition, Downer will review its emission reduction approach in line with Intergovernmental Panel on Climate Change (IPCC) updated scientific reports and other developments in low-emissions technology, to ensure a practical and affordable transition towards this commitment.
Managing our GHG emissions
As an integrated service provider, we operate within carbon-intensive industries such as asphalt manufacturing and mining operations. A key challenge for us is the effective management of our carbon-related activities and implementing strategies to reduce our GHG emissions. Conversely, we have the opportunity to engage with our customers and supply chain to positively influence change that reduces their GHG emissions.
The energy and GHG emissions data for FY19 builds on last year, with the inclusion of New Zealand subcontractors, Spotless New Zealand and Hawkins. All recent acquisitions have adopted Downer’s sustainability data reporting protocols7 for Scope 1 and 2 emissions and energy data using an operational control boundary consistent with Australia’s National Greenhouse and Energy Reporting (NGER) scheme. Scope 3 data includes business travel, mining and engineering construction projects where Downer does not have operational control but can influence the emissions profile.
Downer has an extensive supply chain and collecting actual data from subcontractors requires significant effort and remains a challenge. Therefore, we use an estimation methodology for instances where we have been unable to obtain actual data. In FY19 approximately 23 per cent of our Scope 1 emissions were estimated for subcontractor emissions – 11 per cent from our Roads business, 10 per cent New Zealand and two per cent Utilities. Subcontractor data is estimated by collecting a target of 80 per cent of subcontractor fuel consumption based on contractor spend, grouping contractors by similar activities, calculating a contractor spend to fuel consumption ratio and estimating the missing data using this ratio. This ratio can be used for five years if 80 per cent is reached and the activities remain consistent. If it is not reached, the ratio is calculated using the actual data collected and the business repeats the process the following year striving for the 80 per cent target.
New Zealand was unable to collect actual subcontractor data this reporting period due to resourcing constraints, therefore the estimation procedure for subcontractor emissions could not be used. Instead, an alternative method was used, with the fuel consumption to subcontractor spend ratios calculated through the standard procedure being replaced by the average ratios from the Australian business for similar subcontractor types (haulage and other contractor types).
In the Transport and Infrastructure Division, there was a significant change in the estimated subcontractor data due to resetting of the fuel consumption to subcontractor spend ratios. This was last determined five years ago in line with our reporting procedures. As a result the contractor spend for the year was similar to FY18, however, the emissions have reduced significantly by 72 per cent, accounting for a 24ktCO2-e reduction.
This adjustment had a five per cent impact on the Group’s Scope 1 and 2 emissions.
5Decarbonisation includes the use of registered certified offsets.
6This is consistent with a 1.5 degree pathway using the latest International Panel on Climate Change (IPCC) scientific reports
7Scope 1 emissions are those produced directly by Downer Group activities
Scope 2 emissions are indirect emissions, such as electricity consumption
Scope 3 emissions are those that occur from sources not owned or controlled by Downer.
from FY18


Overall Scope 1 and 2 emissions and energy consumption increased for the year due to the inclusion of Hawkins and Spotless NZ (10 ktCO2-e) and the inclusion of New Zealand subcontractor data (36 ktCO2-e), accounting for an 11 per cent increase to our Scope 1 and 2 emissions.
Scope 2 emissions reduced by one per cent due to consolidation of facilities and energy efficiency projects across the business.
Scope 3 emissions reduced due to the reduction in large energy intensive mining operations in FY18, for example the completion of the Roy Hill contract. However, business travel has increased by 31 per cent compared to FY18. This increase is attributed to an increase in air travel and the inclusion of rental vehicles which were not reported in FY18.
This year Downer’s GHG emissions intensity has decreased by nine per cent when compared to FY18 levels, primarily due to the stabilising of our GHG emissions and increase in revenue.
Scope 1 and 2 Greenhouse
Gas Emissions (ktCO2-e)
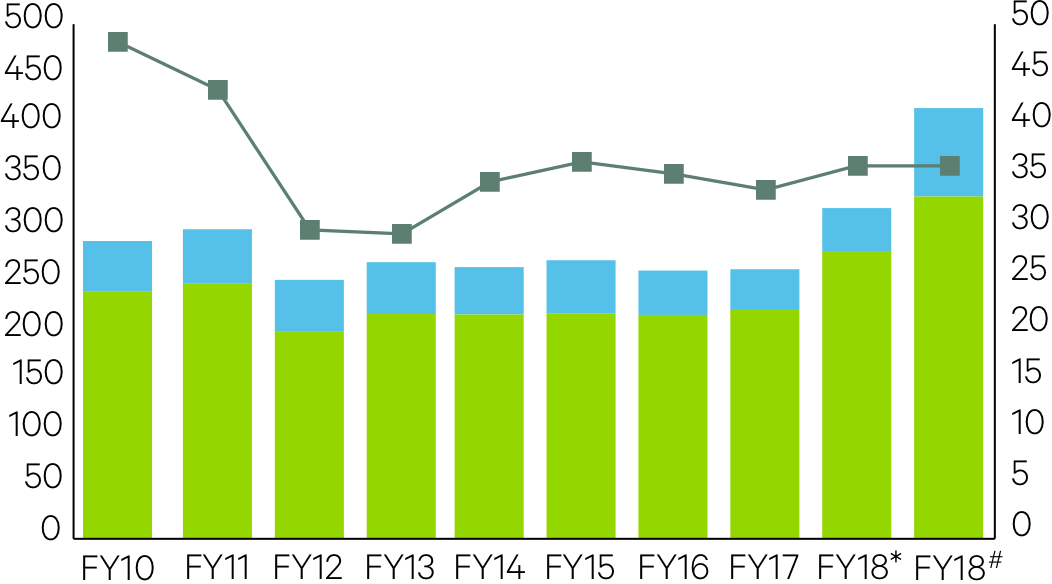
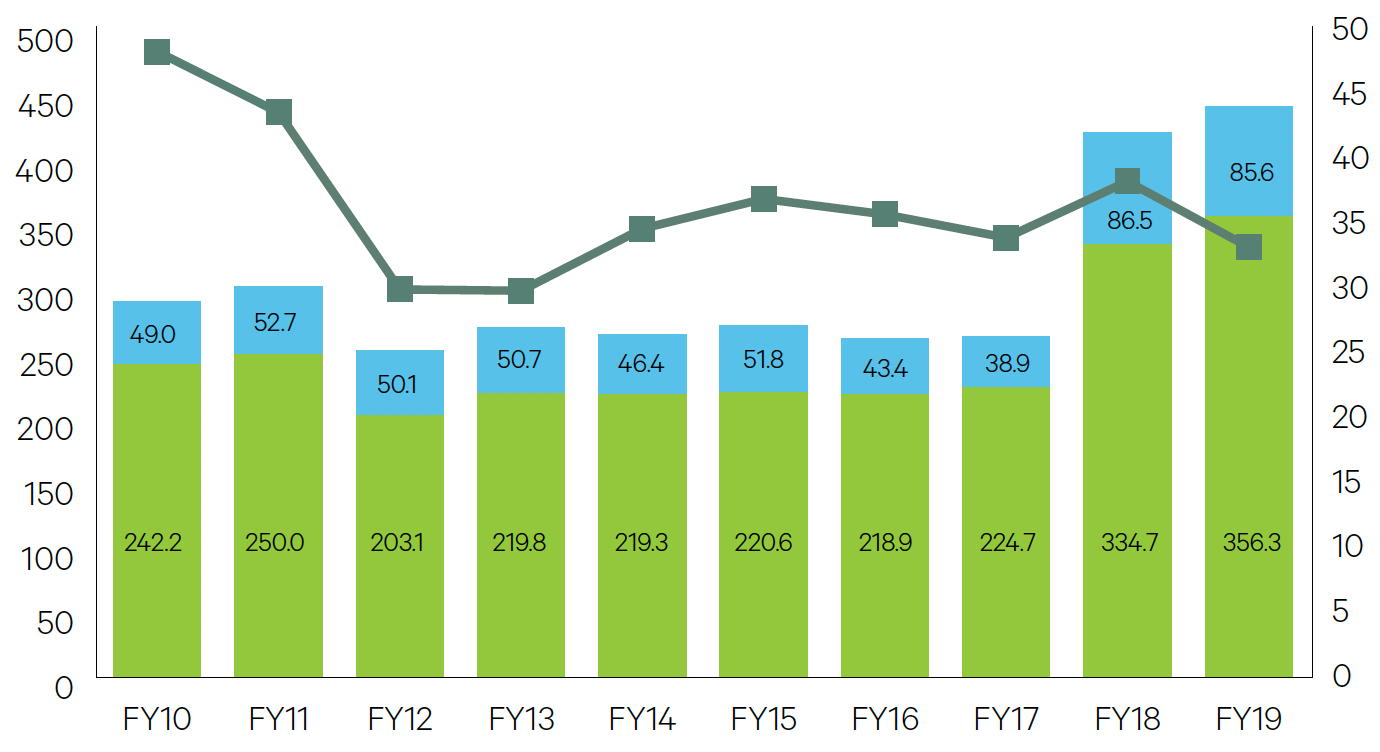
Our FY19 emissions sources remained reasonably consistent with FY18 with the primary source (64 per cent) of our total Scope 1 and 2 GHG emissions being the consumption of liquid fossil derived fuels (mostly diesel oil) used in our transport fleet and the use of stationary energy in our asphalt and other manufacturing plants. The liquid fuel proportion has increased slightly with the inclusion of New Zealand’s subcontractor data, reduction in electricity and stabilisation of natural gas consumption.
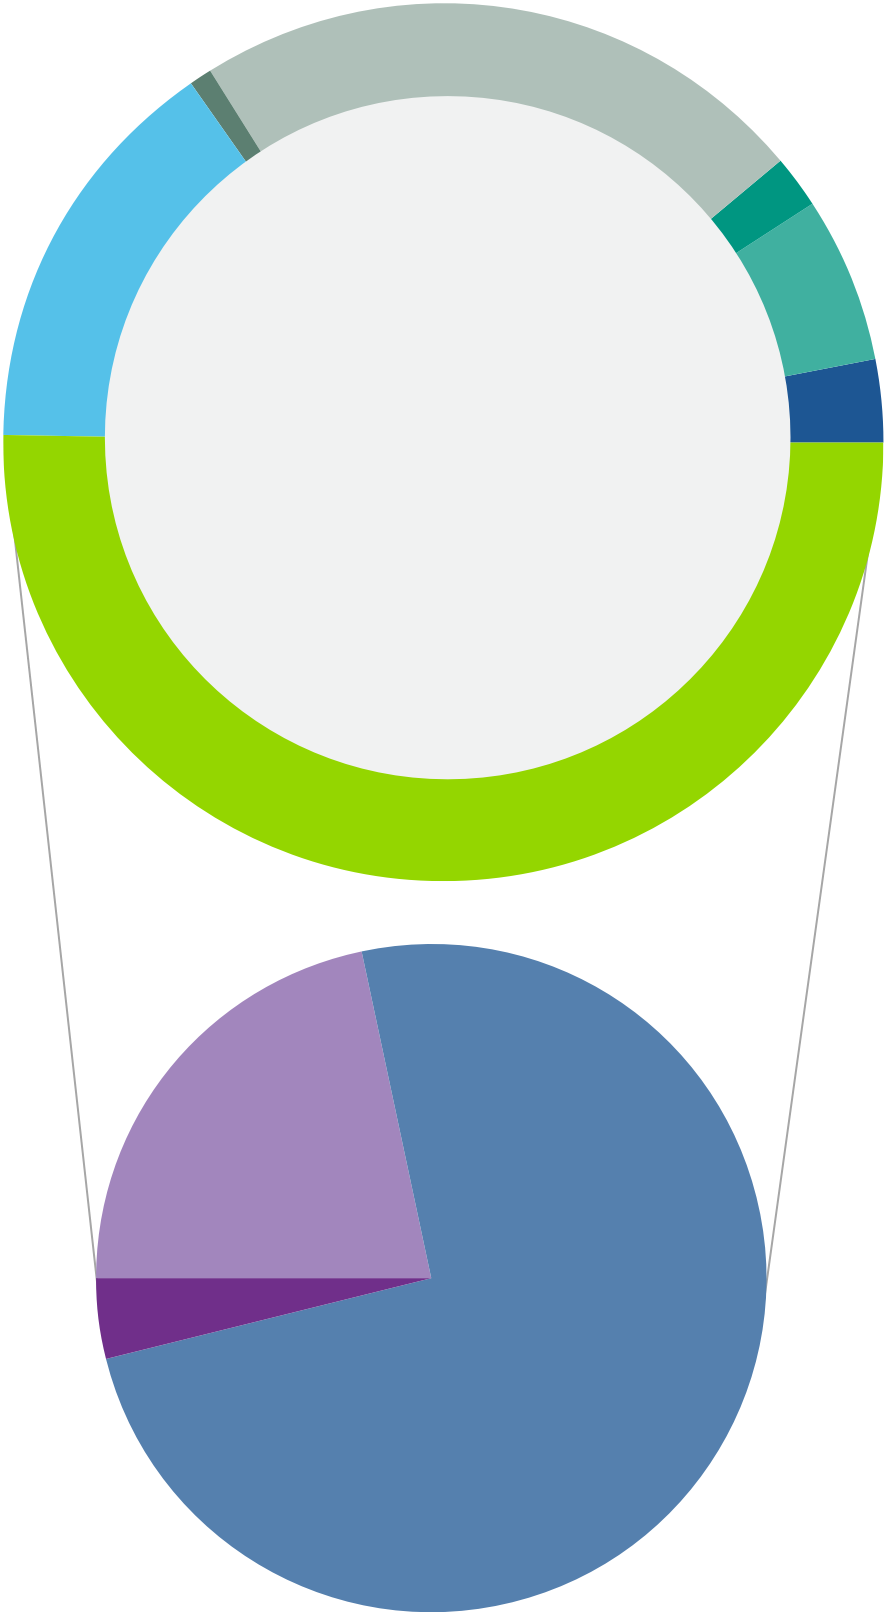
Breakdown of Scope 1 and 2
emissions by source (ktCO2-e)

In FY19, 46 per cent of Scope 1 and 2 emissions came from the Transport and Infrastructure Division, with the Roads business contributing 36 per cent. This is due to the high number of diesel fleet and subcontractor fleet operating, as well as the high carbon intensity of asphalt plants. Downer is continuing to investigate opportunities for decarbonisation of the fleet by switching to transitional fuel sources and piloting new technologies.
Breakdown of Scope 1 and 2
emissions by Business Line

In FY19, due to the restructure of the business and acquisitions, Downer reset the GHG emission baseline year levels to FY18 and each Division developed three-year GHG reduction plans with new targets for both FY19 and an aspirational target for FY21. The decarbonisation pathway associated with Downer’s science-based target stated above will be used to guide the setting of these annual GHG emission reduction targets.
We implemented 42 new projects during FY19 with a combined capacity to deliver annualised abatement of over 9,678 tonnes of annualised GHG emission (CO2-e) reductions across Scope 1 (natural gas efficiency projects, vehicle replacement and optimisation), Scope 2 (lighting upgrades, office consolidations) and defined Scope 3 (energy consumption for non-operational control projects). This exceeded the FY19 Stretch target of 7,166 tonnes of annualised GHG emission (CO2-e) reductions.
Reducing Scope 3 GHG emissions with our data centres
Downer not only looks at the emissions that it has direct control over, but also those emissions (Scope 3) that it can influence within it supply chain. In partnership with DXC, Downer leverages the low carbon footprint that their principle Sydney datacentre at Eastern Creek (known as Aurora) delivers:
- Best in class data centres in Australia to date have Power Usage Effectiveness (PUE) ratio around 1.7 – Aurora‘s target data centre efficiency is PUE 1.38
- Hot-aisle containment, ventilation and air-conditioning services, including air to air heat exchangers for the IT cells, redefines state-of-the-art
- DXC Carbon Emissions Management Service – assessment service to assist organisations calculate energy consumption and greenhouse gas emissions from the use of IT assisting with efficiency and compliance-based carbon reporting
- Downer additionally now saves approximately 900 reams of paper per year through more effective printer management.
DXC has a proven track record in supporting Downer’s goals for GHG emission reductions. Last year DXC reduced carbon gas emissions from its collective data centre environments by approximately 15 per cent, coupled with an overall reduction in energy consumption worldwide by approximately 12 per cent. This delivered Downer a net saving of 48 per cent in kWh over a year across our fleet.