Managing our GHG emissions
Scope 1 and 2 emissions
As an integrated service provider, Downer operates within capital and carbon-intensive industries such as mining services and asphalt manufacturing. A key challenge for us is the effective management of our carbon-related activities and the implementation of strategies to reduce our GHG emissions.
Downer has commenced the journey of proactive engagement with our customers and our supply chain, through the development of our Scope 3 emissions inventory and registration with the CDP supply chain program. With regard to our customers, Downer’s role is to ensure that we are providing low-carbon products, and managing assets to minimise their carbon intensity – either through maximising their efficiency or recommending replacement where this is economically viable.
In FY21, Downer successfully divested its Laundries business and completed the sale of all its Mining businesses, with the exception of Open Cut East. The complete sale of Laundries and Mining will substantially reduce the Group’s Scope 1 and 2 GHG emissions by approximately 35 per cent – or 206,000 tonnes – of carbon dioxide equivalent, based on FY20 data.
Downer has an extensive supply chain and collecting data from subcontractors requires significant effort and remains a challenge. Therefore, we use an estimation methodology when we have been unable to obtain actual data. In FY21, approximately 27 per cent of our Scope 1 emissions came from subcontractors (actual and estimates), which consisted of 15 per cent from our Road Services and Infrastructure Projects businesses, 11 per cent New Zealand and one per cent Utilities. The methodology for estimating data is described below:
- Subcontractors were grouped into categories on the basis that they perform similar types of work when engaged by Downer and therefore are very likely to use similar types and relative volumes of energy consuming resources. The information received from these subcontractors formed the actual resource usage data. The remaining energy reported was based on a ratio between actual energy versus equivalent spend, which was applied across the remaining spend per category.
New Zealand was unable to collect actual subcontractor data this reporting period due to resourcing constraints, therefore the estimation procedure for subcontractor emissions could not be used. Instead, an alternative method was used, with the fuel-consumption-to-subcontractor spend ratios calculated through the standard procedure being replaced by the average ratios from the Australian business for similar subcontractor types (haulage and other contractor types).
from FY20
- The boundary and methodologies used for Scope 3 emissions in the 2020 Sustainability Report are not comparable to those used within the 2021 Sustainability Report. Therefore, Downer has restated the figures presented in FY20. See Scope 3 emissions section for a breakdown.
Overall Scope 1 and 2 emissions decreased by 14 per cent.
Scope 1 emissions decreased by 13 per cent, which was largely due to a decrease in natural gas usage as a result of the divestment of the Laundries business.
Road Services emissions decreased due to a lower portion of emissions arising from subcontractors.
Scope 2 emissions dropped by 20 per cent. Similar to Scope 1 emissions, this was largely as a result of the divestment of the Laundries business.
Rollingstock Services’ electricity usage fell seven per cent due to a continued focus on efficiencies and the utilisation of onsite solar.
Downer’s other divestments did not have a material impact on Scope 1 and 2 emissions. This is because a large majority of facilities (with the exception of some Downer Blasting Services sites) were not within Downer’s operational control boundary.
Downer has retained ownership of the Open Cut East business throughout FY21, including the Commodore Mine and Meandu Mine (reported here). The Commodore Mine represents approximately 39,000 tCO2-e and Meandu Mine approximately 97,000 tCO2-e (a total of approximately 27 per cent of total Scope 1 and 2 emissions), based on FY21 figures. At the time of writing, Downer was continuing to explore opportunities to divest the Open Cut East business. If Downer is successful in the sale of Open Cut East, there will be a commensurate impact on Downer’s Scope 1 and 2 emissions in the FY22 reporting period.
Scope 1 and 2 greenhouse gas emissions (tCO2-e)
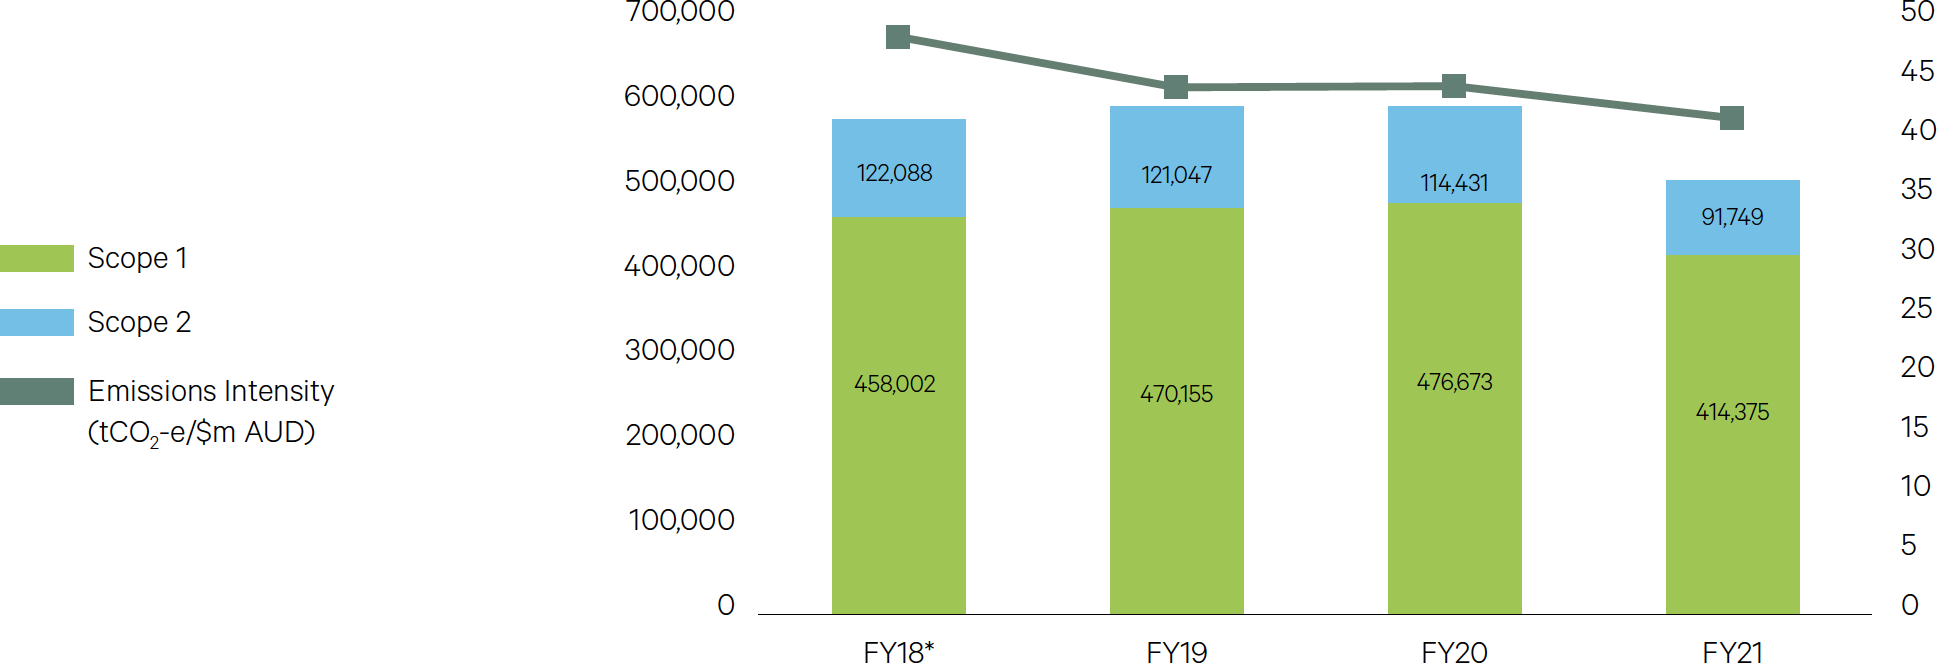
* Split between Scope 1 and 2 emissions for FY18 has been re-stated due to the provision of more accurate data.
Total Scope 1 and 2 emissions for FY18 remain unchanged.
Scope 1 and 2 emissions – adjusted for divestments
from FY20
The table above shows Downer’s Scope 1 and 2 emissions, where FY20 figures have been adjusted for the divestments which took place in FY21. Downer achieved a decrease across most of our portfolio, with Mining and Road Services contributing to the majority of the reductions.
Percentage breakdown of Scope 1 and 2 emissions by source
from coal mining
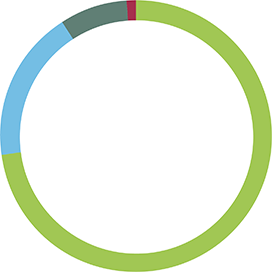
Liquid Fuels
73%
Electricity
18%
Natural gas
8%
Fugitive emissions from
coal mining 1%
Emissions from
wastewater
0%
Refrigerants and steam
0%
Breakdown of Scope 1 and 2 emissions by Business Unit
Mineral Technologies
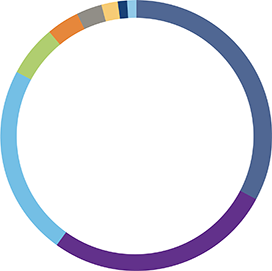
Road Services
33%
Mining
27%
New Zealand
23%
Spotless
6%
Utlities
4%
Infrastructure Projects
3%
Rollingstock Services
2%
Asset Services
1%
Group and Services
1%
Defence and Mineral Technologies
0%
Downer’s contribution to renewable energy
Renewable energy consumed
Renewable projects delivered
Capacity of renewable power installed
Homes powered
Emissions avoided
In FY21, renewable power generation in Australia continued to accelerate. According to the Clean Energy Regulator’s latest Quarterly Carbon Market Report (which, at the time of this report’s publication, was the March Quarter 2021 report), the Clean Energy Regulator expects approximately 3,400MW of large-scale capacity will be accredited in 2021, taking the total to around 15,000MW generated since 2017.
In February 2020, Downer announced we would withdraw from the construction of large-scale solar-to-grid projects, as there are too many inherent risks due to large power loss factors, grid stability problems, connection risks, and equipment performance issues.
Downer decreased renewable energy consumption from 5,706GJ in FY20 to 5,635GJ in FY21 in its own operations, primarily due to the removal of Laundries from Downer’s emissions portfolio.
- The disclosure of how many homes powered by solar and wind projects Downer has delivered has been calculated by dividing the total electricity generated for FY21 by the average household electricity use in Australia. Electricity generation figures have been obtained from AEMO’s ‘Actual Generation and Load’ reporting. Average household electricity consumption has been sourced from the Australian Energy Regulator’s Annual Report on Compliance and Performance of the Retail Energy Market 2017-18. Avoided emissions has been calculated using the total electricity generated figures sourced from AEMO for each generation asset, multiplied by emissions factor for the National Electricity Market (NEM), sourced from Table 6 of the National Greenhouse Account (NGA) Factors 2020.
Scope 3 emissions
In FY21, Downer performed a full assessment of its Scope 3 emissions portfolio in accordance with the Greenhouse Gas Protocol’s Corporate Value Chain (Scope 3) Standard.
Overall, it has been determined that emissions from purchased goods and services are Downer’s most material emissions source. Other significant sources include lifecycle emissions from asphalt production, downstream emissions from the transport of goods produced, and supplier emissions.
A significant exclusion is that of the Scope 3 emissions from coal extraction. Downer’s involvement in coal mining is limited to the extraction of coal, and the operation of coal mines on behalf of our customers. Downer accounts for coal extraction as part of its Scope 1 and 2 emissions portfolio – accounting for the emissions incurred in extracting coal from the ground, including direct fuel usage and fugitive emissions.
The two categories deemed to be potentially applicable are Category 9 (Downstream transport and distribution) and Category 11 (Use of sold products).
Downer has not recorded any emissions against Category 9. For both significant mines within Downer’s operational portfolio (Commodore and Meandu), the ultimate sole customer is a power station which is directly adjacent to the mine site boundary. Therefore, any downstream emissions are likely already accounted for within Scope 1 and 2 emissions, and any residual emissions in transporting coal over the site boundary are likely to be immaterial.
Further, Downer has not accounted for any emissions in Category 11, as Downer is not involved in the commercial transaction for the sale of the coal. The rights and rewards for the extracted coal lie with our customers, Stanwell Corporation (Meandu) and Intergen (Commodore). Therefore, any Scope 3 emissions should be recorded by these organisations.
Breakdown of Scope 3 emissions
Downer has signed up to the Carbon Disclosure Project supply chain program to measure emissions from this category more accurately.
Downer’s distribution of asphalt, concrete and bitumen are calculated in Category 11 ‘Use of sold products’ using a lifecycle emissions factor (cradle to grave).
Downer’s distribution of coal was considered in this category, however all coal from Downer’s two thermal coal mines (Meandu and Commodore) are transferred to their ultimate sole customer, being a coal-fired power station located adjacent to each mine. The emissions associated with the transportation of these are captured within Downer’s Scope 1 emissions portfolio.
Asphalt LCA factors were obtained from Review of Emissions Reduction Opportunities – Department of Planning, Transport and Infrastructure.
Bitumen LCA factors were obtained from Sustainable Asset Management (Subtopic: Carbon emissions modelling of road pavement treatment strategies).
Concrete LCA factors were obtained from the Centre for Earth Systems Engineering and Management (Life Cycle Assessment of Pre-Cast Concrete vs cast-in-place concrete).