Managing our GHG emissions
As an integrated service provider, Downer operates within capital and carbon-intensive industries such as mining services, asphalt manufacturing and laundries. A key challenge for us is the effective management of our carbon related activities and implementing strategies to reduce our GHG emissions. We also have the opportunity to engage with our customers and supply chain to positively influence change that reduces their GHG emissions.
No significant acquisitions or divestments occurred in FY20 and hence are not included in the data. Downer has determined its boundary using the concept of ‘operational control’, compliant with Australia’s National Greenhouse and Energy Reporting (NGER) scheme. For the purposes of energy and GHG data in the Sustainability Report, this boundary determination extends to our non-Australian operations.
Downer has leveraged the Science-Based Target Initiative’s framework and guidance to set an ambitious long-term GHG emissions reduction target. This is referred to as Downer’s Science-Based Target (SBT) throughout this report.
The SBT boundary consists of Downer’s operational control Scope 1 and 2 GHG emissions data plus the Scope 1 and 2 emissions from our operations at Meandu Mine. Downer holds operational control of Meandu Mine, but there is a transfer certificate in place under section 22J of the NGER Act. This transfers the reporting obligations to Stanwell Corporation Limited.
Scope 3 data includes business travel, mining and engineering construction projects where Downer does not have operational control but can influence the emissions profile. For the first time, Downer is reporting on the Scope 3 impacts of waste to landfill across its portfolio.
Downer has an extensive supply chain and collecting data from subcontractors requires significant effort and remains a challenge. Therefore, we use an estimation methodology when we have been unable to obtain actual data. In FY20, approximately 32 per cent of our Scope 1 emissions came from subcontractors (actual and estimates), which consisted of 17 per cent from our Road Services business, 13 per cent New Zealand and two per cent Utilities. The methodology for estimating data is described below:
- (i) Subcontractors were grouped into categories on the basis that they perform similar types of work when engaged by Downer and therefore are very likely to use similar types and relative volumes of energy consuming resources. These categories are as follows:
- Engineering & Construction, Road Services, Transport Projects businesses
- Cartage
- All other categories/non-categorised activities
- Technology & Communications business
- Communications projects
- Engineering & Construction, Road Services, Transport Projects businesses
Exclusions:
- Raw material purchases – payments to subcontractors purely for purchases are not related to activity, and therefore no fuel consumption has occurred from these.
- Consultant spend – office-based or where no/little fuel was consumed in the course of activities performed while subcontracted by Downer.
The information received from these suppliers formed the actual resource usage data. The remaining energy reported was based on a ratio between actual energy versus equivalent spend, which was applied across the remaining spend per category, in accordance with the following formulas:
- Calculate unique fuel ratio for each category
- Average actual resource usage (for relevant FY, in raw units) divided by actual spend in dollars (for FY20, for contractors who returned actual resource usage data) = A
- Calculate estimated fuel usage for the remaining contractors in that category
- A multiplied by the value (in dollars) of remaining contract spend per category (for contractors who did not return any actual data) = B
New Zealand was unable to collect actual subcontractor data this reporting period due to resourcing constraints and the impacts of COVID-19, therefore the estimation procedure for subcontractor emissions could not be used. Instead, an alternative method was used, with the fuel-consumption-to-subcontractor spend ratios calculated through the standard procedure being replaced by the average ratios from the Australian business for similar subcontractor types (haulage and other contractor types).
In New Zealand, there was a significant change in the estimated subcontractor data due to resetting of the fuel-consumption-to-subcontractor spend ratios, despite a similar contractor spend to FY19. This was applied to the three-year comparison period.
For FY18, the impact of this revision is an increase in Scope 1 emissions of 54,480 tCO2-e, and energy consumption of 780.2 TJ. For FY19 this represented an increase in Scope 1 emissions of 14,549 tCO2-e and energy consumption of 206.7 TJ.
from FY19


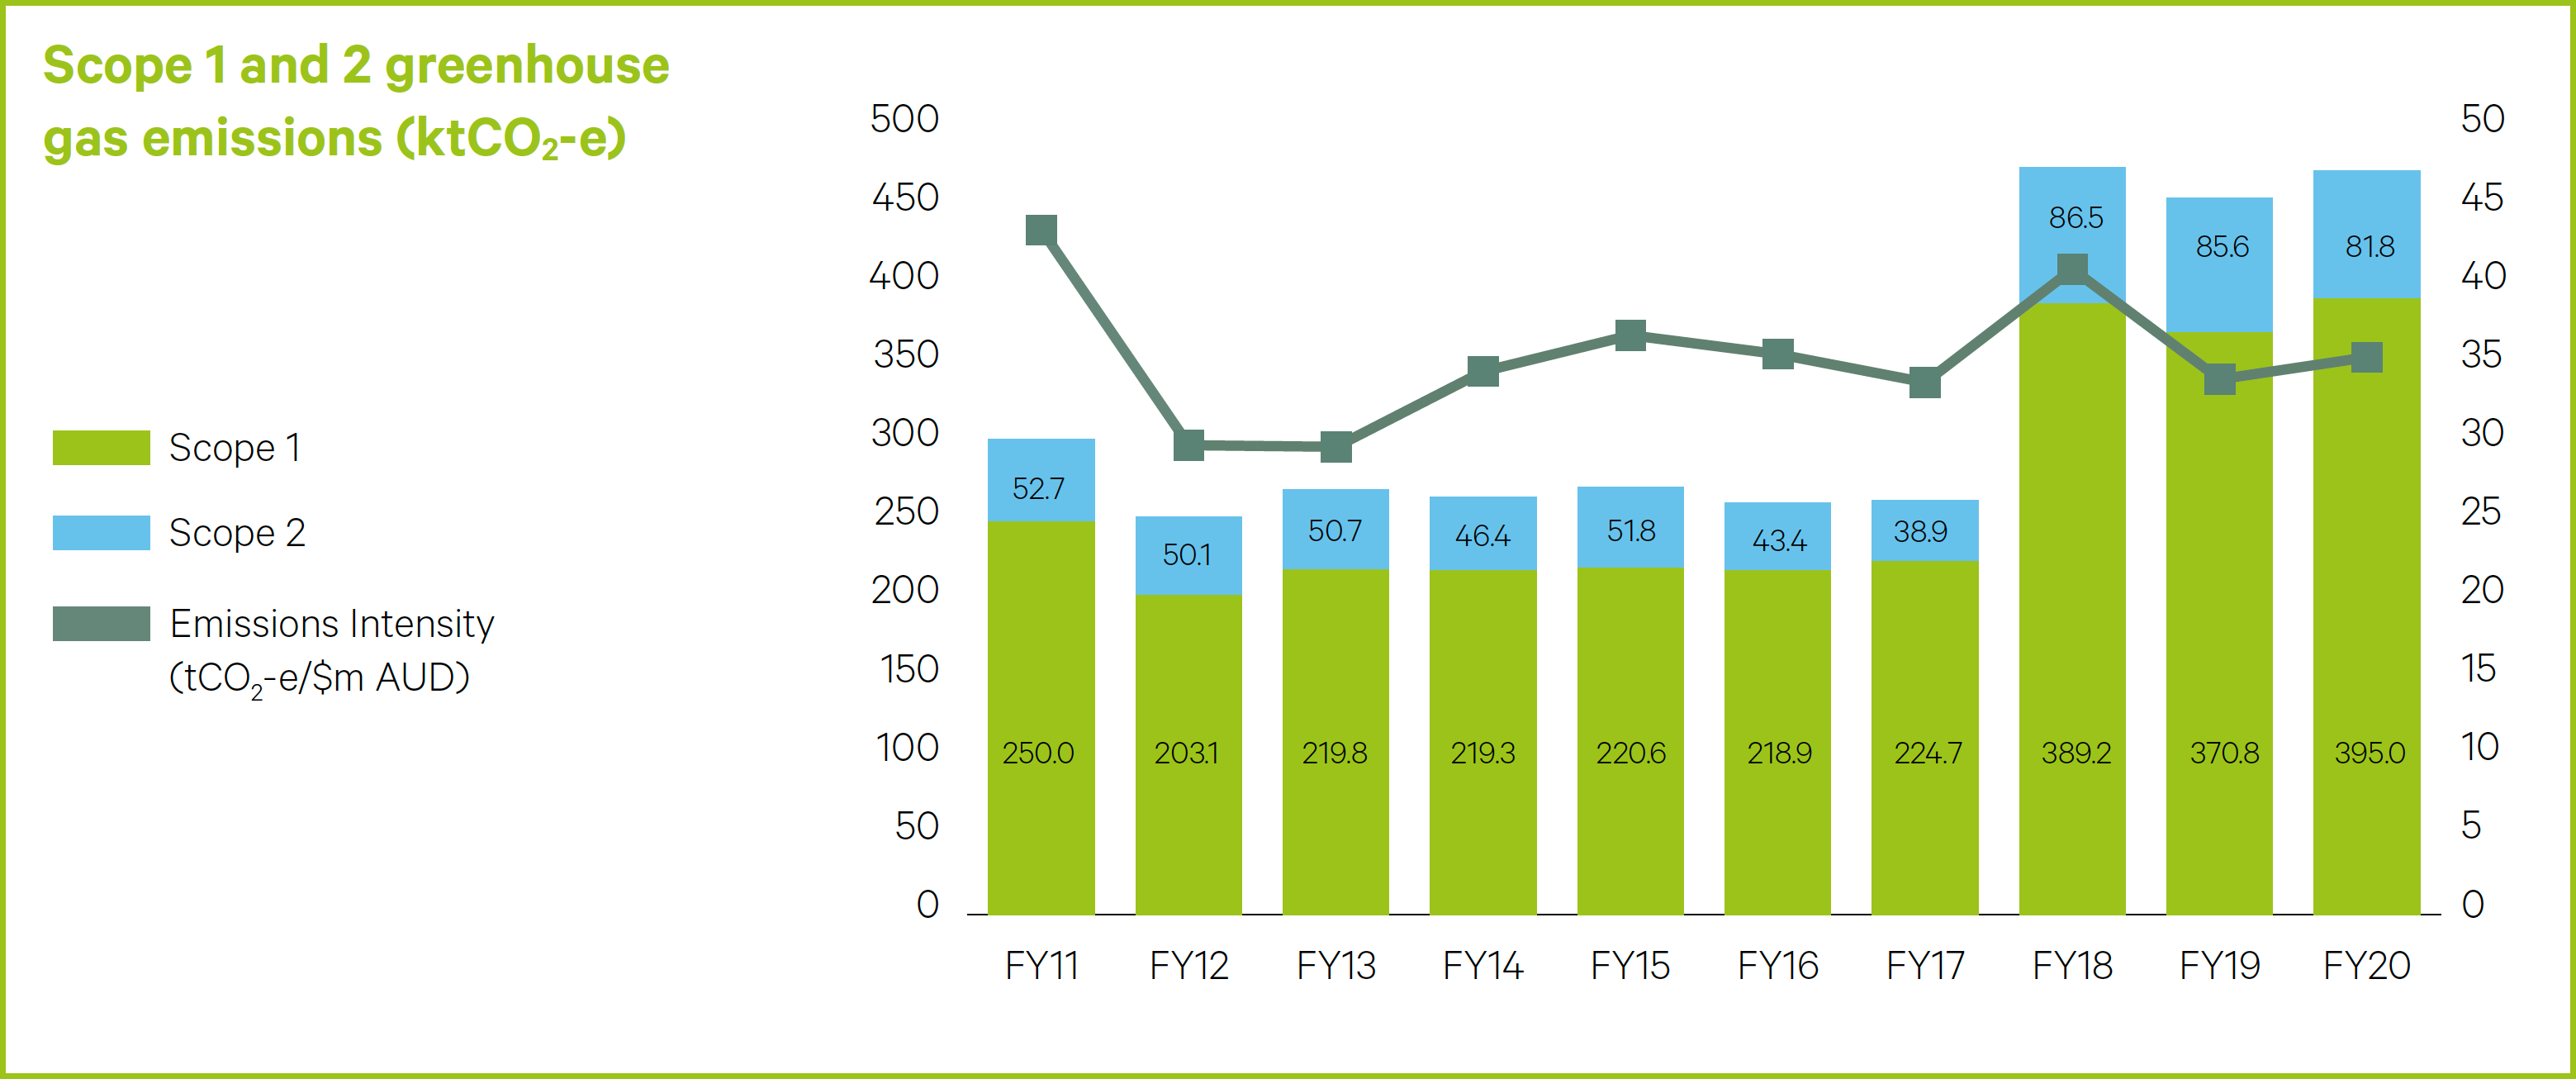
Overall Scope 1 and 2 emissions increased by four per cent. Scope 1 emissions rose by seven per cent, and this was largely due to increased activity in the Road Services business, which increased asphalt production and expanded operating hours and scope of road works. Other drivers included an increase in diesel usage at the Commodore Mine due to contractual requirements, as well as one-off construction activities, both of which were not tied to increases in Run of Mine (ROM) coal production.
Scope 2 emissions dropped by four per cent, and this was predominantly due to the impact of COVID-19-related restrictions across the business. Spotless’ Australian operations, which represents 47 per cent of Scope 2 emissions, saw a nine per cent drop year-on-year.
The Q4 average Scope 2 emissions was down 19 per cent compared to average emissions in Q1-Q3 – which were consistent with FY19 emissions, prior to the COVID-19 lockdowns. Other reductions were achieved in the Engineering & Construction business, which saw significant energy efficiency enhancements, including the installation of LED lighting and the replacement of an ageing air compressor with a more modern unit. The Utilities business also achieved reductions, primarily due to a net reduction in project activity, with major projects coming to completion and the commencement of a large number of minor projects with a significantly lower emissions profile. There were some increases in the Road Services and Rollingstock Services businesses, commensurate with their ability to maintain or expand operations during COVID-19.
Scope 3 emissions increased, predominantly due to an increase in emissions in Downer’s non-operational control mine sites. There are also two new inclusions – emissions from Spotless sites that are not under Downer’s operational control, and also Scope 3 emissions relating to waste to landfill. These increases and expansions to reporting scope are offset by a significant decrease in emissions from air travel, which fell 50.1 per cent year-on-year. This is primarily, but not solely, due to the impacts of COVID-19. A breakdown of the COVID-19 period and the non- COVID-19 period is as follows:
- For the Q4 FY20 period (most affected by COVID-19) compared to the Q4 FY19 period, emissions fell 90 per cent
- For Q1-Q3 FY20 compared to Q1-Q3 FY19, emissions fell 39.2 per cent, reflecting a systematic reduction in demand for air travel prior to impact of COVID-19.
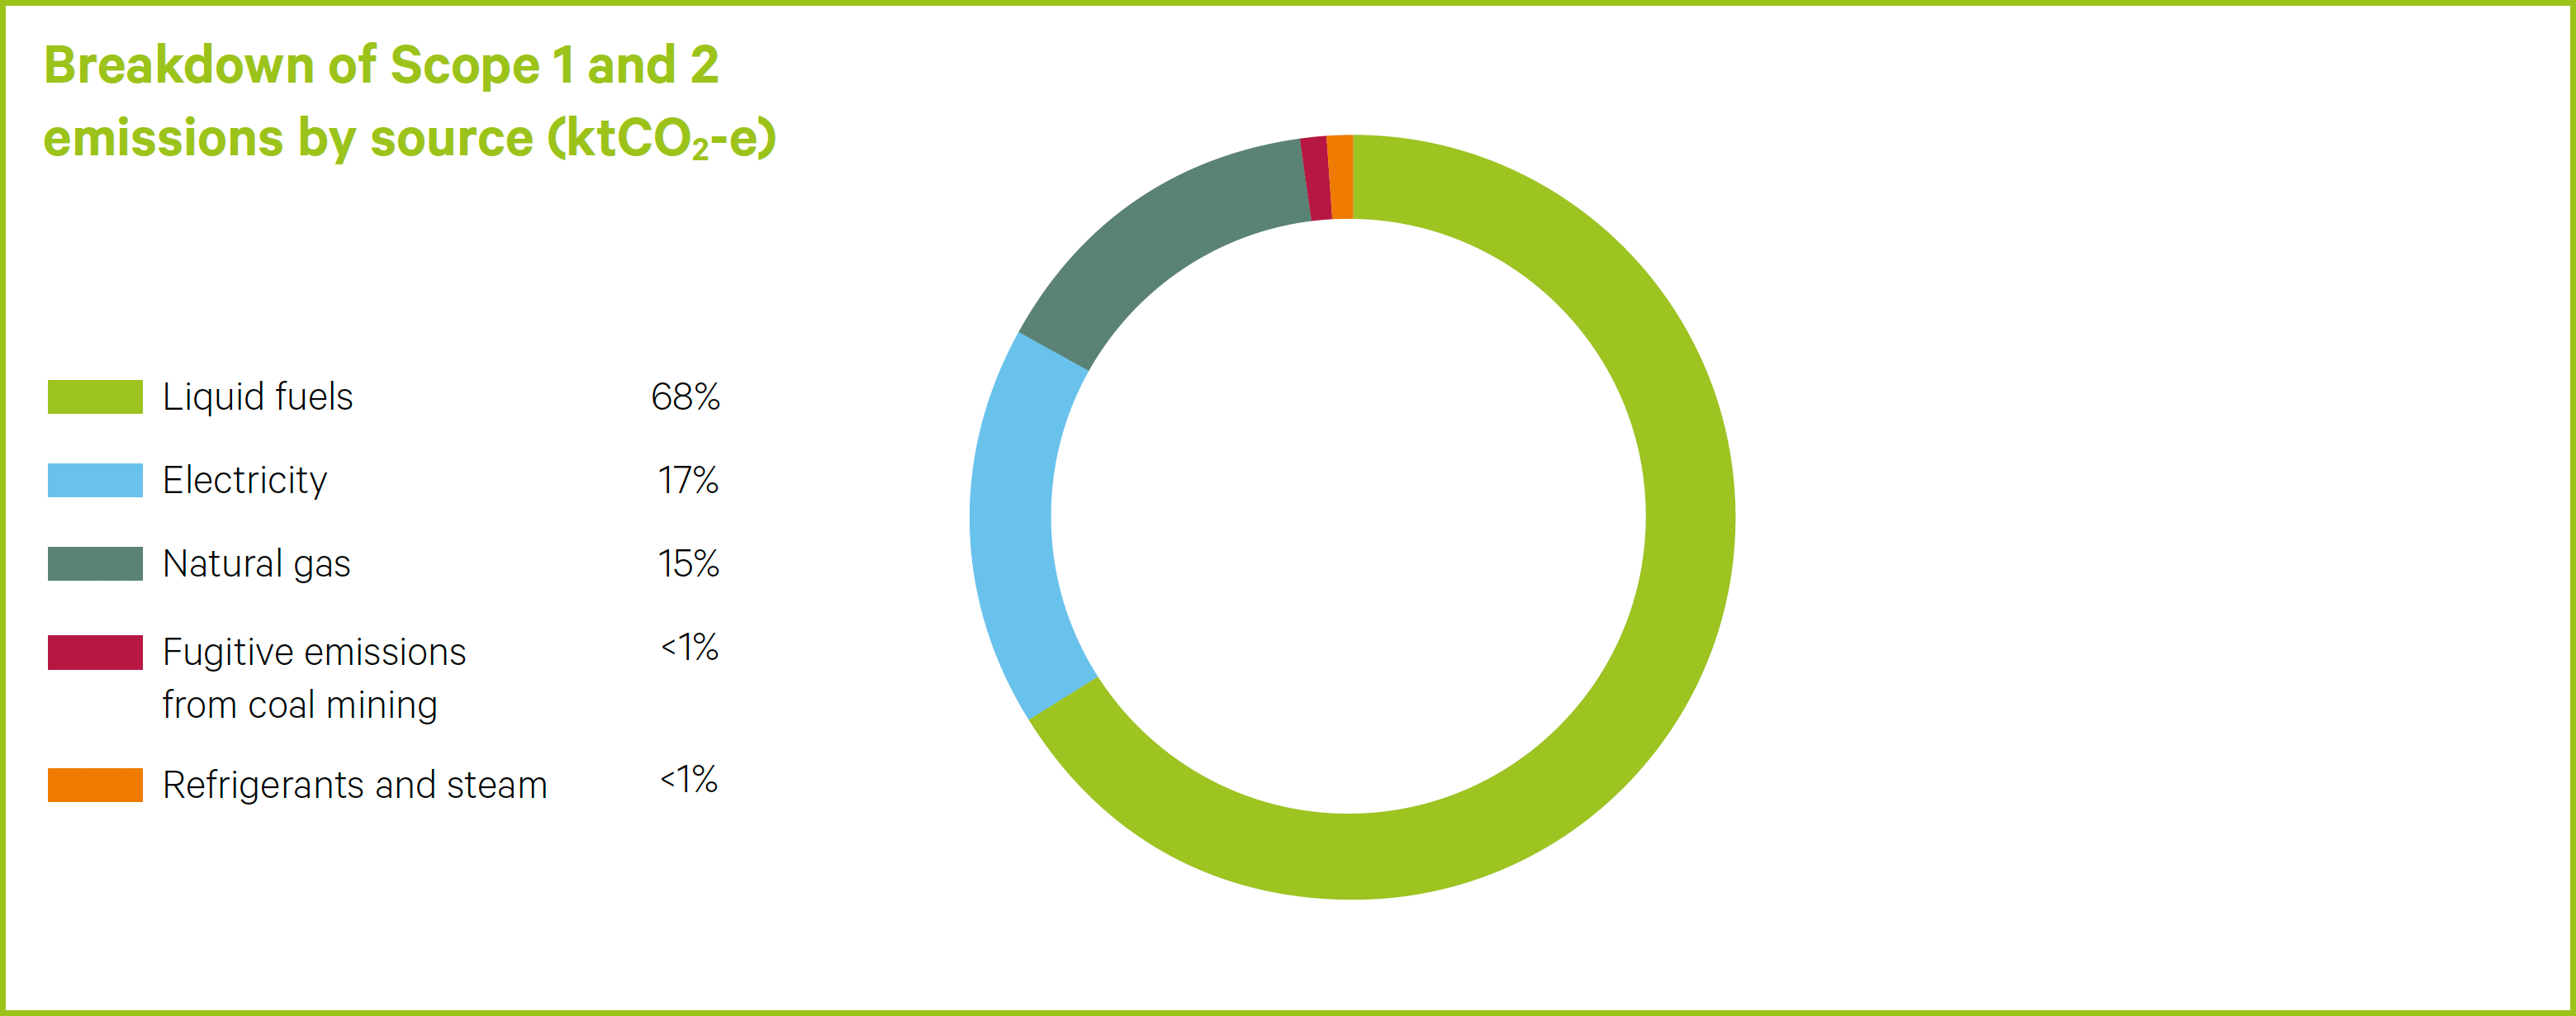
Our FY20 emissions sources remained reasonably consistent with FY19 with the primary source (68 per cent) of our total Scope 1 and 2 GHG emissions being the consumption of liquid fossil derived fuels (mostly diesel oil) used in our transport fleet and the use of stationary energy in our asphalt and other manufacturing plants. The liquid fuel proportion has increased slightly with the revision of estimates associated with subcontractor data, as well as a reduction in absolute electricity usage due to the impacts of COVID-19.
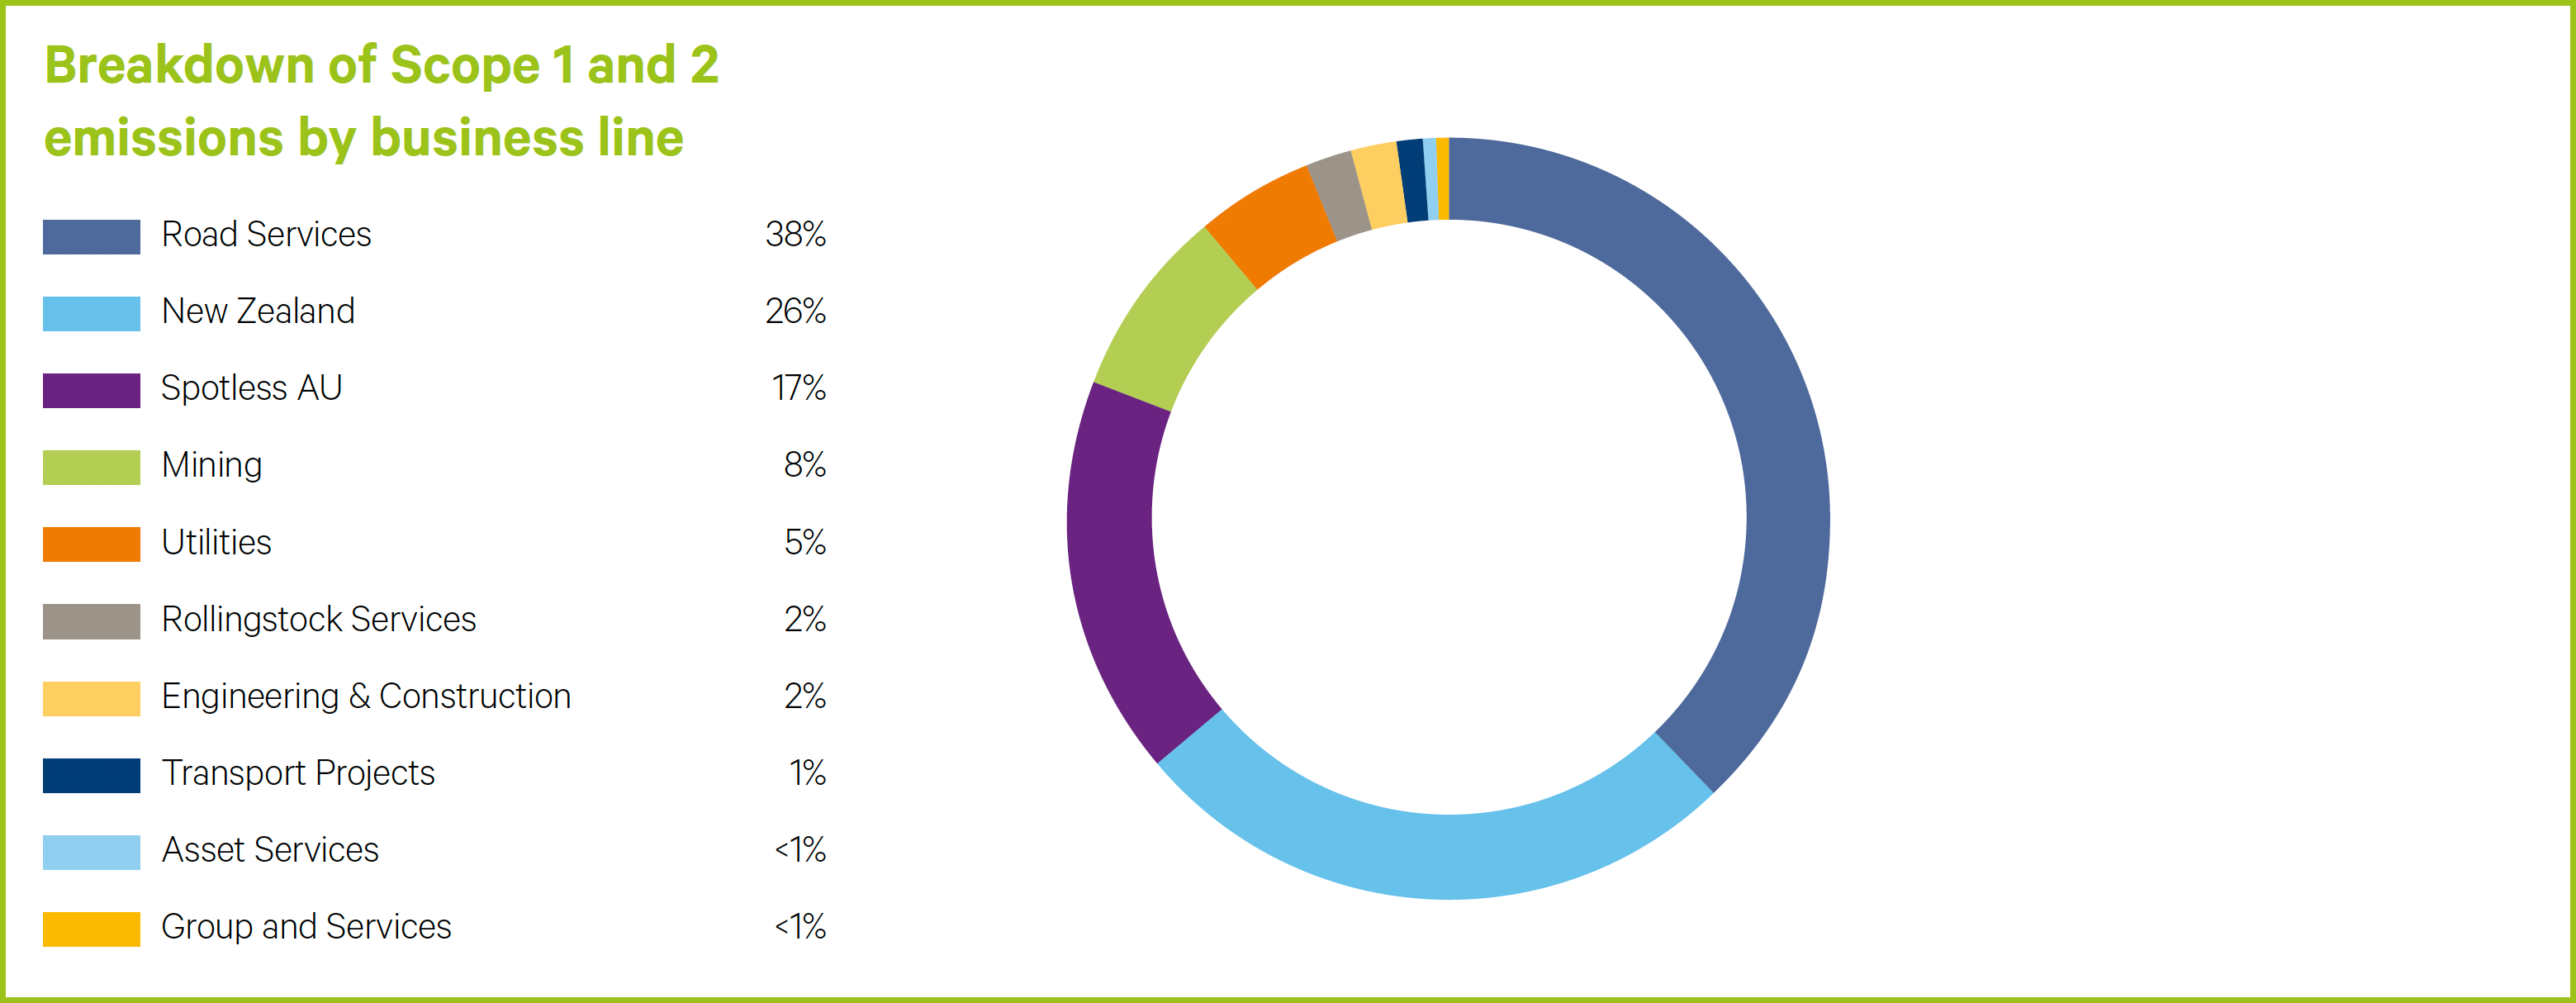
In FY20, 38 per cent of Scope 1 and 2 emissions came from the Road Services business. This is due to the high number of diesel fleet and subcontractor fleet operating, as well as the high carbon intensity of asphalt plants. Downer is investigating the possibility of improving the efficiency of these asphalt plants through upgrades, as well as reviewing opportunities for fleet optimisation when commercially viable options become available.
Spotless’ contribution to Scope 1 and 2 emissions dropped from 21 per cent in FY19 to 17 per cent in FY20. This was largely due to the impact of COVID-19 on operations, which had widespread impacts on the full gamut of Spotless’ services, including facilities management, hospitality and laundries. Laundries was affected the least by the COVID-19 restrictions, however, it still saw lower linen volumes, driven by the restrictions placed on elective surgery which makes up a considerable portion of its linen processed.
Linking remuneration to GHG emissions reduction
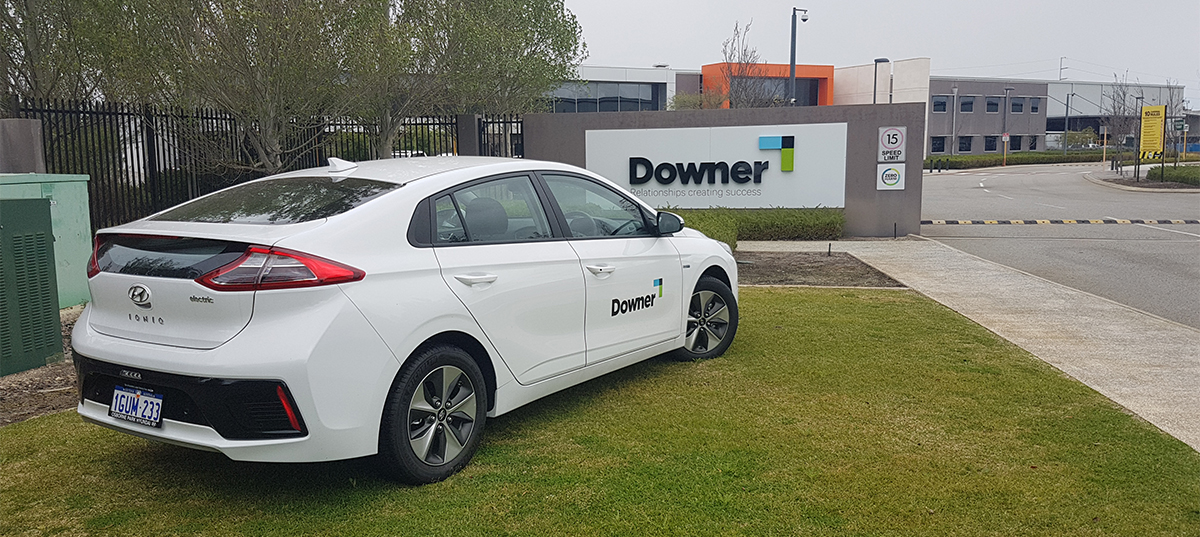
One initiative to reduce GHG emissions across the Group is trialling the use of electric vehicles. In FY20, Downer’s Asset Services team introduced Hyundai IONIQ electric vehicles to its light fleet in Western Australia and NSW.
Downer Executives’ remuneration is linked to emissions reduction targets under Downer’s Short-Term Incentive (STI) plan.
Under the three-year emissions reduction plans that commenced in FY19, Downer implemented 35 new projects during FY20 with a combined capacity to deliver annualised abatement of over 5,114 tonnes of GHG emissions (CO2-e) reductions across Scope 1 (natural gas efficiency projects, vehicle replacement and optimisation), Scope 2 (lighting upgrades, office consolidations) and defined Scope 3 (energy consumption for non-operational control projects). This fell short of the threshold level of 5,411 tCO2-e, which is the minimum target set among the Group. The operational impacts of COVID-19 saw a number of projects that were planned for the year placed on hold or cancelled entirely. This largely affected the Mining and New Zealand businesses, although the New Zealand business was still able to complete some planned initiatives before the onset of COVID-19.
The Spotless business exceeded its Stretch target of 720 tCO2-e, driven largely by strong energy efficiency improvements within the Laundries business – a strong result in the face of decreased efficiencies through running sub-optimal loads due to reduced demand during the COVID-19 crisis.
The Transport Projects and Rollingstock Services businesses also achieved their Stretch targets. The Rollingstock Services business achieved this on the back of a continuing program of energy efficiency improvements, including lighting upgrades and compressor replacements. The Transport Projects business replaced an existing diesel generator with a biodiesel generator, showing an early phase example of the impacts of fuel switching in the business, which will be a key strategy for Downer’s decarbonisation journey moving forward.